Solutions


Continuous Energy Monitoring, Powered by Eniscope
The Eniscope platform is the technology foundation behind everything Summa does. It uses submetering to measure individual circuits in your facility, giving you real-time, itemized visibility into your energy use, from any device, anywhere.
What will Eniscope tell you that you don't already know?
If you've ever looked at a utility bill and wondered where all that energy went, you're not alone. Most facilities run on assumptions. Someone thinks the chiller is fine. The HVAC system is running as scheduled. The new motor is more efficient than the old one. But you can't manage what you can't measure.
"On average, 30% of the energy used in commercial buildings is wasted, which presents building owners and managers with a huge opportunity for operating cost savings."
U.S. Department of Energy
Submetering and continuous monitoring show you where that waste is happening.
Once You Can See the Leak, You Can Fix It
These aren't dramatic problems. They're the ordinary, invisible waste that adds up.
Hospitality: $4,000 a Month
Grocery: 3 Million kWh
Three Outcomes from Continuous Monitoring
Reduce energy costs. See where energy is being wasted, often where no one suspects. Identify what drives your highest costs and peak demand. Confirm operational changes deliver the savings you expected, so savings don't erode over time.
Avoid downtime and equipment failures. Catch refrigeration, HVAC, pump, and motor problems before they become outages. Detect power quality issues that shorten equipment life. A failure you catch early is a maintenance ticket. A failure you catch late is a lost production day.
Make informed capital investment decisions. Build measurement and verification into every capital project. Qualify for utility incentive programs that require M&V documentation. Make the internal business case for upgrades with defensible numbers, not vendor claims.
How It Works
Three integrated components: hardware, software, and human expertise.
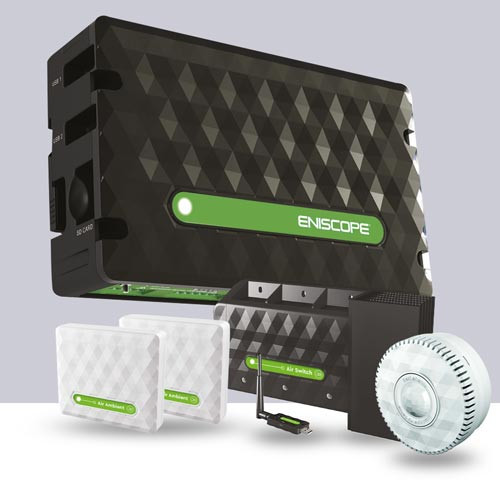
IoT Hardware
Cloud Software Platform
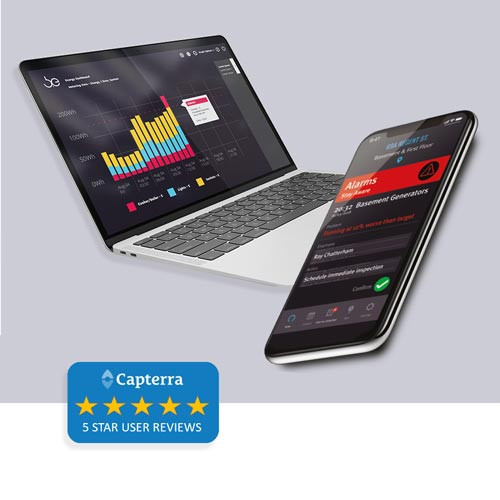
Virtual Energy Management

Why Submetering Works
One Wisconsin example. A dairy was preparing to spend $50,000 to replace a 20-year-old variable frequency drive on a key piece of process equipment. Power metering showed the new drive would offer no measurable efficiency gain. The dairy kept the existing drive and avoided the $50,000 expense. The capital freed up was redirected to other efficiency projects. (Source: Focus on Energy, Dairy Processing Industry Energy Best Practices Guidebook)
That's M&V before the investment, not after.
Get Your Free Energy Waste Report
Not sure where to start? We'll review your utility data and give you an honest estimate of what your facility is likely wasting, before you commit to anything.
Contact Us